With the 3.3 release of Terracotta we have come up with a brilliant feature called "Operator Events Console". The main idea behind this project was to come up with a dynamic UI which will inform the operator of Terracotta cluster of some very important events which he/she might be interested in to ensure the smooth operation of the cluster. This feature is enterprise only and is not available for open source kit. In this blog i will try to explain how does the new feature look and what all operations it comes up with.
To take an example i will have a cluster with two server stripes (multiple server stripes are enterprise only feature) each having one active and one passive server. Click on config to download the tc config i used for the demonstration
I started two servers (server1 and server3) from two different stripes (so that cluster is ready for action) since the dev console doesn't get ready till at least one of the sever in each stripe is not up and running. Then start the dev console and let it connect to "localhost:9521". If you list "Monitoring" tab in the console left pane then you will see a new item called "Operator Events". Below is the screen shot for it. Once you click that it will show you what all important events have happened till now.

I will now start the two more server and start and kill some clients and run some DGC cycles to get some important events. After this the operator events console shows like the screenshot below.

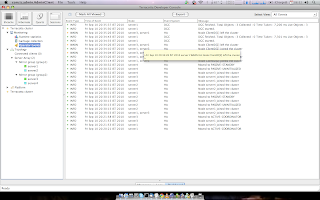
If you see then the new events that came through are in bold text and the one we already saw when we started the dev console are not. This is to show the operators that these new events have happened since you connected the dev console to the cluster.
If you click any of the row the bold text will become non bold which will mark that you have read the event already. Below is the screen shot showing this.

If you want to mark all event as read then you can click the button "Mark All Viewed" and then all the events would be marked as non bold. Below is the screen shot after i clicked that button.
You can filter the events by selecting any kind of filters in the select view drop down list. Below are the screen shots demonstrating this.


Also if you notice then in the node columns we see similar events clubbed (We see two nodes name in the same row). If you hover the mouse over it then it will show a pop up explaining what the other similar event was. Below is the screen shot for it.

The cool thing about this feature is that the operator does not need to monitor all the events at all the time. The dev console can be started at any point of time and we can see all the events happened before. This is because we store a number of events happened in each server to show when dev console is connected. Also there is a limit to the number of events we show in this panel. Both are controlled by tc the following tc properties respectively.
dev.console.max.operator.events = 5000
l2.operator.events.store = 1500
The operator can also export all the events into a text file by clicking "Export" button. This text file can be very handy to be sent in case of debugging for what went wrong in the cluster. Below is the screen shot for the same.
This feature is aimed to reduce the pain point of looking into huge log files to debug what went wrong and also for the operator to know the overall health of the system so that he/she can take corrective measures in case of trouble.
Feed back for this are most welcome.

