Friday, September 10, 2010

Terracotta Operator Events Console

With the 3.3 release of Terracotta we have come up with a brilliant feature called "Operator Events Console". The main idea behind this project was to come up with a dynamic UI which will inform the operator of Terracotta cluster of some very important events which he/she might be interested in to ensure the smooth operation of the cluster. This feature is enterprise only and is not available for open source kit. In this blog i will try to explain how does the new feature look and what all operations it comes up with.

To take an example i will have a cluster with two server stripes (multiple server stripes are enterprise only feature) each having one active and one passive server. Click on config to download the tc config i used for the demonstration

I started two servers (server1 and server3) from two different stripes (so that cluster is ready for action) since the dev console doesn't get ready till at least one of the sever in each stripe is not up and running. Then start the dev console and let it connect to "localhost:9521". If you list "Monitoring" tab in the console left pane then you will see a new item called "Operator Events". Below is the screen shot for it. Once you click that it will show you what all important events have happened till now.


I will now start the two more server and start and kill some clients and run some DGC cycles to get some important events. After this the operator events console shows like the screenshot below.

If you see then the new events that came through are in bold text and the one we already saw when we started the dev console are not. This is to show the operators that these new events have happened since you connected the dev console to the cluster.
If you click any of the row the bold text will become non bold which will mark that you have read the event already. Below is the screen shot showing this.

If you want to mark all event as read then you can click the button "Mark All Viewed" and then all the events would be marked as non bold. Below is the screen shot after i clicked that button.

You can filter the events by selecting any kind of filters in the select view drop down list. Below are the screen shots demonstrating this.


Also if you notice then in the node columns we see similar events clubbed (We see two nodes name in the same row). If you hover the mouse over it then it will show a pop up explaining what the other similar event was. Below is the screen shot for it.
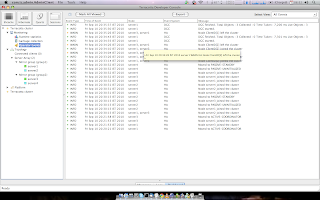
The cool thing about this feature is that the operator does not need to monitor all the events at all the time. The dev console can be started at any point of time and we can see all the events happened before. This is because we store a number of events happened in each server to show when dev console is connected. Also there is a limit to the number of events we show in this panel. Both are controlled by tc the following tc properties respectively.

dev.console.max.operator.events = 5000

l2.operator.events.store = 1500

The operator can also export all the events into a text file by clicking "Export" button. This text file can be very handy to be sent in case of debugging for what went wrong in the cluster. Below is the screen shot for the same.

This feature is aimed to reduce the pain point of looking into huge log files to debug what went wrong and also for the operator to know the overall health of the system so that he/she can take corrective measures in case of trouble.

Feed back for this are most welcome.

Wednesday, February 17, 2010

Terracotta Ehcache Sync Write Feature

Terracotta's latest release has a loads of new feature. This blog is to describe Ehcache sync write feature

Sync Write Lock, Old Behavior
The previous version had the following behavior on using sync write locks:

For a sync write lock, on unlock it waits until it gets an acknowledgment from the server that the transaction has been processed and applied on all the other L1s having changes from that transaction.

Basically a call like this:

ManagerUtil.commitLock(lockId, SYNC_WRITE);

This call will wait until all the transactions associated with this lock have been acknowledged by the server i.e. applied on all the L1s and the ack has been received back from all the concerned clients (to which the broadcast was made).

Sync Write Lock, New Behavior
The new release has focused on making the performance of sync write lock better.

In the new implementation server acks the client immediately when it receives a transaction batch from a client. To achieve this server now has a acknowledgment which will ensure that the client knows that the server has received the transaction batch.

So when this ack is received for this transaction, a client simply releases the lock locally (only possible when the lock is greedy). This ensures that this client can make use of the lock but will make all the other clients wait for it (since the lock will only be recalled once all the transactions for this lock will be flushed).

Performance
The numbers are only for 1 client and 1 thread and are only to demonstrate that there is not much degradation in the performance

Number of Elements: 1m
synchronousWrite false : TPS = 19873
synchronousWrite true : TPS = 19094

How to turn it on/off
To enable or disable this we need to add synchronousWrites=true|false in the terracotta element in the ehcache.xml

Below is a sample of the ehcache.xml which has this set as true

<?xml version="1.0" encoding="UTF-8"?>
<ehcache xmlns:xsi="http://www.w3.org/2001/XMLSchema-instance"
xsi:noNamespaceSchemaLocation="ehcache.xsd" updateCheck="true"
monitoring="autodetect" dynamicConfig="true">
<cache name="testCache" maxElementsInMemory="1000000" eternal="false"
timeToIdleSeconds="0" timeToLiveSeconds="0" overflowToDisk="false" synchronousWrites="false" >
<terracotta />
</cache>
<terracottaConfig url="eng03:9510" />
</ehcache>

Here is the Source code for my test

Thursday, May 21, 2009

Terracotta's Distributed Garbage Collector


Purpose of this blog is to explain what terracotta's distributed garbage collector solves and then i'll go through some steps which can help setup DGC so that it catches up with the application's garbage creation rate.

Lets first understand what is garbage in terracotta's world. The architecture terracotta follow is that it has an array of terracotta servers called L2s and then a number of applications (user apps called L1s) which share data across each other connected to all the L2s. In the shared object if any L1 changes anything then that delta change is propagated to all the L1s through the array of L2s. So whenever a new object is created in the shared object graph it will be created on of the the L2s and if any of the other L1 needs it will fault that from the particular L2. So as your application proceed it will create a lot of objects spread through all the L2s in the shared object graph.
Now any L1 can make the reference of any of that object to null thus leading to a shared object graph in which a number of objects would no longer be reachable from the root thus creating garbage. The jvm GC will collect those objects in L1s but it would be terracotta's job to collect them from the L2.

So to cut the long story short we have an object graph spread across a number of servers with a number of objects as garbage. Below is a pictorial view where each reactangle represent one L2


As you can see here object 6, 7, 9 and 11 are garbage and terracotta's DGC has to identify and delete them from each L2.

Terracotta's DGC is actually a concurrent mark and sweep garbage collector. The way DGC works can be explained in the steps below

1. Each server array has an active coordinator which coordinates among all L2s for the whole DGC cycle
2. Coordinator sends a init message to each L2 for starting the DGC cycle
3. Each L2 starts the dgc cycle by assuming all objects it has as garbage candidate
4. The coordinator then sends a collect message which tells all L2s to remove objects which are reachable from the roots to be removed from the garbage candidates.
5. For each object reachable from any of the roots, L2 removes it from the gc candidates and fetches the referenced objects and then execute one of the following step to remove all objects reachable from this object
  • If the referenced object reside in the same server it execute step 5 for this object
  • If the referenced object reside in any other server then the current server sends a message to that server with this referenced object id which does step 5 for the particular object
6. Next step is rescue in which objects which become reachable from root during mark phase are rescued from the gc candidates. This step pauses the application so that no references are changed/created.
7. After mark stage is completed objects in disk are sweeped by Berkeley DB cleaner. In Active-Passive mode, the resulting garbage is notified to Passive so that passive deletes those objects.
8. One of the challenge of this implementation was to synchronize each step. As the object graph is distributed and no server knows the whole graph, determining when the traversal is over is complex. The way its done is as follows
  • A ticker token message is passed around starting from the coordiantor and in a circle to each active server
  • Upon receiving of a ticker token each server updates its state to be clean if it has nothing to process for traversal and dirty if it is processing.
  • When this ticker comes back to the coordinator and is clean then it means that no server has anything left to process and hence the step is considered to be complete.
The distribution of the object graph makes the implementation complex for failure cases. To the cycle to be able to complete each active server group has to be available during the time of the dgc cycle. If any one of them gets disconnected the particular cycle has to be canceled. Following are the conditions to start and complete a DGC cycle
  1. DGC cycle would not start if another cycle is already running and is not in delete stage
  2. DGC cycle would not start (DGC would be in disabled state) if any of the passive of any of the group is sycncing with the active
  3. DGC cycle will get cancled if any of the group becomes unavilable during the cycle and the cycle is not in delete stage
  4. If a failover happens when mark phase is completed then the cycle is not canceled and all the groups which are up will process its delete stage and delete garbage.
The implementation has a lot of synchronization challenges and the algorithm has performed tremendously good. We have seen a DGC cycle complete in less than 40 seconds for around 8m objects with 4 active server group.

Things to tune for DGC to perform better

The most siginficant bottleneck for a DGC cycle is disk. So whenever the objects of the graph are swapped out of memory and are in disk, their lookup and deletion both becomes expensive and that can cause dgc cycle to take a long time to complete which in turn cane make dgc fall behind the garbage creation rate which in turn increases the possibility of objects to be in disk rather than memory making dgc more and more slow.
Whenever DGC is perfroming badly the first thing you should look is "Cache Miss Rate" in dev console for each active server's run time statistics. If that is significantly high then dgc will make objects fault from disk to the memory.
You can overcome this by two approaches
1. Increase the heap size thus making more objects to fit in the memory and reducing the chances of faulting from disk.
2. Make DGC interval shorter, deleting garbage more frequently which may help objects to be in memory and not in disk.

If the delete stage is taking a huge time then you may also want to tune berkely db properties.

Wednesday, June 25, 2008

Tuning Terracotta Cluster using config file


In a cluster production environment there is a lot of tuning involved and as different servers are involved in the process so it becomes really difficult to set the tc-properties at each machine. In 2.7 release of the Terracotta product this issue has been addressed and now it has become really easy to tune the cluster.
Before explaining the new feature lets have a look how the tuning is being done at each server before 2.7 release. Terracotta cluster has a lot of tuning paramerters called tc-properties which a user can set for different servers involved in the cluster. The installation comes with full set of default values for these parameters. To tune the application for a specific environment these properties need to be overwritten. We can overwrite the default tc-properties by creating a file tc.properties and specifying the path while running the server. One other way to overwrite these parameters by adding them to the jvm arguments of the application like "-Dcom.tc.l1.transactionmanager.logging.enabled=true"

The order in which these properties are overwritten is as below
1. Default tc-properties (comes in the installation)
2. Local tc.properties file
3. System properties

The new feature is aimed at giving the user flexibility to set some parameters using tc-config file and as generally in production environment tc-config is kept at one server(L2) and all other nodes(l1) take their config from it so it gives the user a flexibility to set the parameters at one place and getting it reflected at all the nodes.

USAGE
To get the advantage of this feature all you need to do is to add one more section in the tc-config file and you are done. The format of the section is as below

<tc-properties>
<property name="l1.cachemanager.enabled" value="true"/>
<property name="logging.maxLogFileSize" value="1024"/>
<property name="l1.cachemanager.leastCount" value="9000"/>
</tc-properties>

The order in which the tc-properties are overwritten now from 2.7 release is as below
1. Default tc-properties (comes in the installation)
2. Property from the tc-config file
3. Local tc.properties file
4. System properties

Note that we still give precedence to local tc.properties file and system properties. This is because we still want to give the user the option to tune the cluster by setting the properties for individual server. Whenever any property is overwritten by the tc-config file a log entry is added, similarly when any property can not be overwritten because we have set them in local tc.properties or in system properties a warning is added in the logs mentioning the failure of the overwriting by tc-config file.

P.S: You can give tc properties file path while starting the server/clients by adding "-Dcom.tc.properties=<pathToTcPropertiesFile>"

This feature can be a very useful tool for the cluster tuning and i hope people will enjoy using it and i hope this blog can give you help in the same.
Have fun guys!!